They are a lovely couple. We’re not talking about a super popular hollywood couple, but rather a more techy combination: Elasticsearch and Kibana. The beauty and the beast.
Our beast is a distributed, RESTful search and analytics engine capable of solving a growing number of use cases.
The beauty lets you visualize the data indexed in Elasticsearch with a variety of cool graphical tools, like Tile maps, bar charts, pie charts, timelines and more. If you loooove dashboards, This is a couple you should know!
Uh oh, we have a problem
Kibana allows you to create visualizations using its administrator page, which is a designated UI. you can further assemble multiple visualizations into dashboards, and embed those visualizations and dashboards into your app (by using iframes).
But what if you want to create those visualizations programmatically? What if you want to dynamically update those visualizations and dashboards so they will fit to your apps business logic?
Using Kibana’s administrator page, you can only create and update those visualizations and dashboards manually. Once you embed a dashboard, you can’t add, replace, edit or delete any visualization in the embedded dashboard inside your app.
But hey, I’m a free spirit!
Free spirits want to create visualizations programmatically!
Free spirits want to dynamically modify their visualizations and dashboards inside their apps so their users can analyse their precious data according to their app’s specific workflow and business logic.
What should we do then?
Challenge? Accepted!
So we had to develop the ability to create and update visualizations and dashboards dynamically.
One approach is to create all the optional visualizations in Kibana at the beginning, and when our fearless user will launch the app, all the visualizations will be ready for use.
Unfortunately, it’s a bad idea. It could be thousands of options. It’s impossible to think of thousands of optional visualizations. No bueno.
Problem? Solved!
Our approach is to develop a Kibana plugin that exposes Kibana’s functionality, like creating visualizations.This plugin will help us to create and update the visualizations dynamically from our app.
Kibana-API
The current version of our plugin has 3 features:
Set a visualization – Create, edit, replace or add a visualization in embedded dashboards.
Text filter – Add a search feature in an embedded dashboard (Kibana doesn’t allow you do that).
Index pattern functions – Create and set index-patterns from your app. Index patterns identify the Elasticsearch indices that are explorable via your Kibana visualizations and dashboards.
How it works
So how this magic happens? Surprisingly, we barely needed pixie dust or unicorns for that.
Communicate the plugin
We did use an equally great thing – post messages.
Since Kibana is running inside an iframe, isolated from the rest of the app, we needed to use post messages for app – plugin communication.
Index the visualizations in Elasticsearch
The next step is create the visualization. all Kibana visualizations are stored in an Elasticsearch index called “.kibana”, so in order to create a visualization we need to index it according to the relevant visualization structure in “.kibana”.
The plugin has two ways to create a visualization – both by using its “setVisualization” method:
1) The lazy way – use it to create a visualization without the complexity of visualization structures. Simply send your visualization’s id, type (pie, histogram), and fields (for example: client_ip), and your visualization is ready.
Note: this way does not support all of Kibana’s visualization types.
2) The complex way – use it to create a more complex visualization. Using this way you must pass all the relevant visualization structure parameters.
This way supports all of Kibana’s visualization types.
Update the URL
Kibana is URL oriented. All its UI changes are reflected in the URL. So our plugin’s final step is to replace or add the new visualization to the dashboard’s URL.
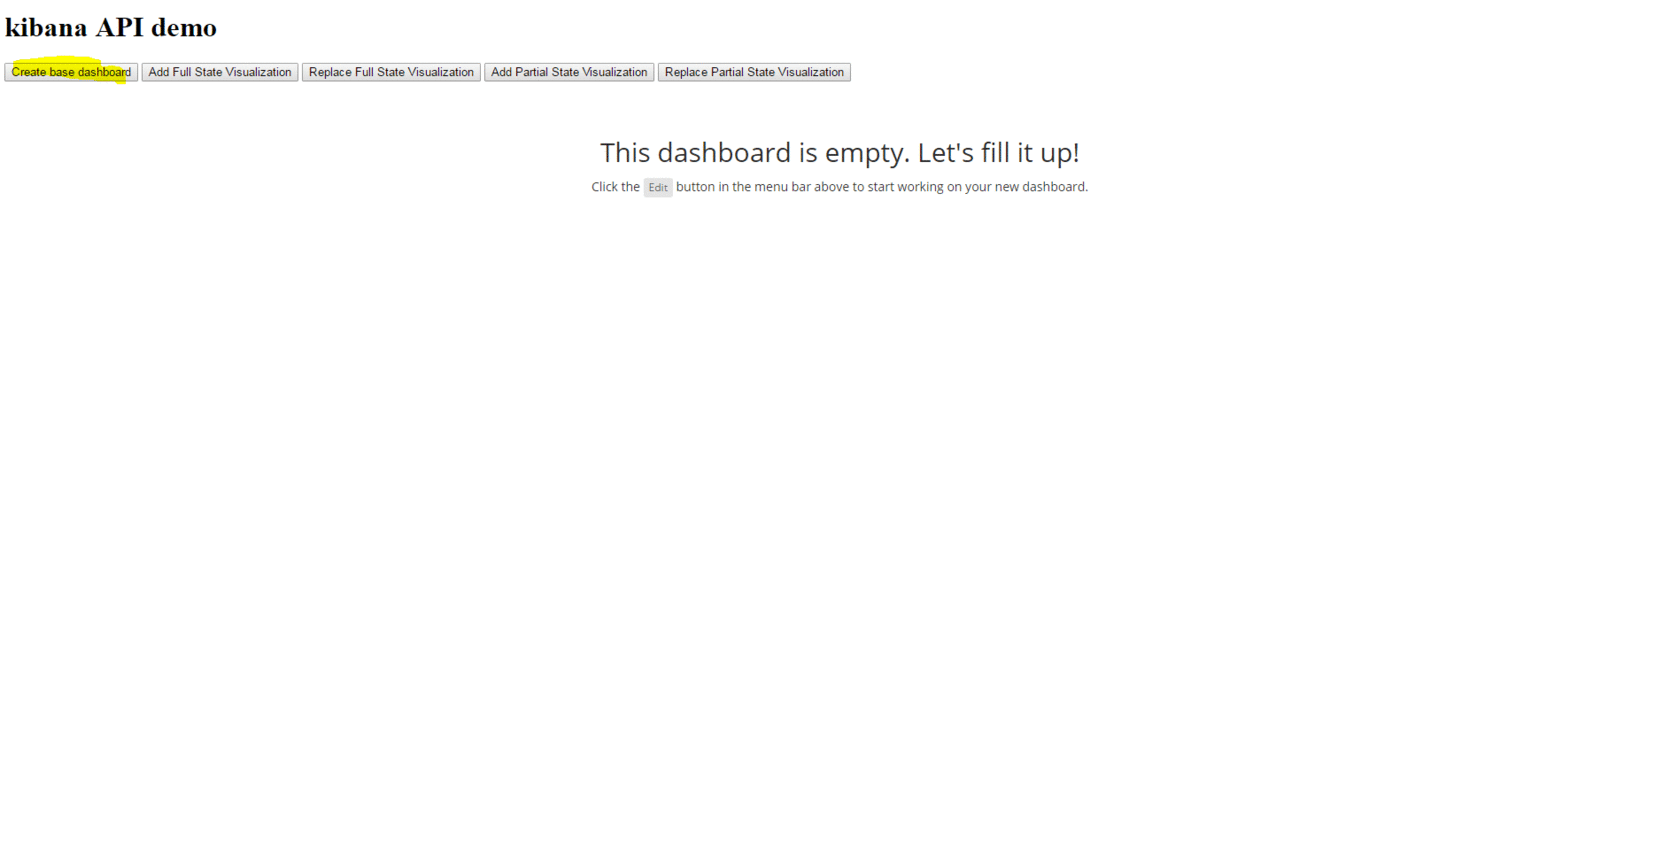
A blogpost is not complete without a gif, so we made one as well
The following gif shows a Kibana dashboard embedded inside a (mock) app.
We can see that the visualizations in the dashboard change dynamically by the user. Every time the user clicks a button, a post messages is sent from the app to the plugin, visualizations are created and indexed into the .kibana index, the dashboard’s url is updated and the iframe is refreshed.
Wanna Help
Our Kibana-API was recently added to Kibana’s official “known plugins” page. Exciting.
A lot of work is still to be made, but that’s a start.
You are more than welcome to come and join the party.