We’ve been using Cesium in the past 4 years and in every project, we stretch performance a bit farther.
In one of our latest projects, we thought we optimized enough, and then a demand came asking us to multiply the amount of certain dynamic elements. Cesium optimized the handling of points. However – the rendering of dozens of thousands of labels and billboards consumes quite a bit of resources, and is quite heavy on your single thread javascript app.
Let’s try to make them better.
The first thing we need to do is to see how much of a challenge this issue really is. In order to do that, we will use Chrome performance tool.
Let’s write our code. Our code would be very simple. It’s going to place lots of cute cats (billboards) with hoops (ellipses) on the map in Washinton area, and add a label of the cute’s number (… labels):
function randomCoordinateJitter(degree, margin) {
    return degree + margin * (Math.random() - 0.5) / 0.5;
}

var viewer = new Cesium.Viewer('cesiumContainer');
var nCats = 15000;
for (var i = 0; i <= nCats; i++) {
    var entity = viewer.entities.add({
        position : Cesium.Cartesian3.fromDegrees(
            randomCoordinateJitter(-77.009003, .5),
            randomCoordinateJitter(38.889931, .5)
        ),
        label : {
            text : 'CUTE #' + i
        },
        billboard : {
            height : 24,
            width : 36,
            image : 'https://encrypted-tbn0.gstatic.com/images?q=tbn:ANd9GcRhFpaxDXCS5O9hx90F3ufJI2VnC_wW0lPnrr6BIb18P4V5JXxBCg'
        },
        ellipse : {
            semiMajorAxis : 100,
            semiMinorAxis : 80
        }
    });
}
Warning: running this code might cause slow machines to become non responsive. Play with the for loop iterations (the nCats value above) to make it work on your computer.
Open chrome dev tools, go the the performance tab and start recording.
Results might vary according to your machine’s spec, background processes etc., but you should see a jitter. Let’s have a look at the results summary:
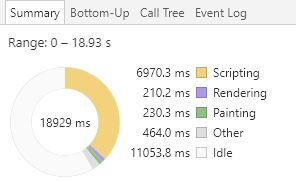
We see that the recording ran for almost 19 seconds, and that scripting was more than 1/3 of the time. This is not so good… Let’s have another take at this after a while the rendering cycle runs:
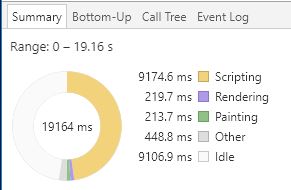
Worse… 19 seconds recording, more than 9 seconds scripting. Let’s see what happens behind the scenes:
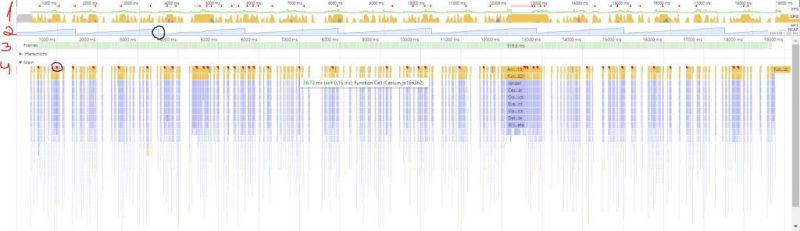
Let’s start from the top:
- You can see a timeline of what occupied the thread. All the yellow parts are scripting.
- You can see the memory usage. This chainsaw pattern is happening because of the rendering cycle – stuff is created during the rendering cycle, then discarded after a while. Note the black circle for the “discard” part (a.k.a. garbage collection).
- The green part below is the frames. Hard to see here, but some are very long.
- Here you can see a chart of the actual methods that have been used in the yellow scripting parts. See the yellow parts with red (as in the blue circle)? These are scripting parts that take too long and thus ruin our user experience (jitter).
That might be a lot to digest if it’s your first time taking a performance recording. If you want to know more, I suggest you head out to google’s amazing website: https://developers.google.com/web/tools/chrome-devtools/evaluate-performance/
Now that we see we have a problem, let’s dive into the code. We will use part number 4 in order to deep dive into the code that ruins our frames. Let’s click on one of the yellow with red parts:
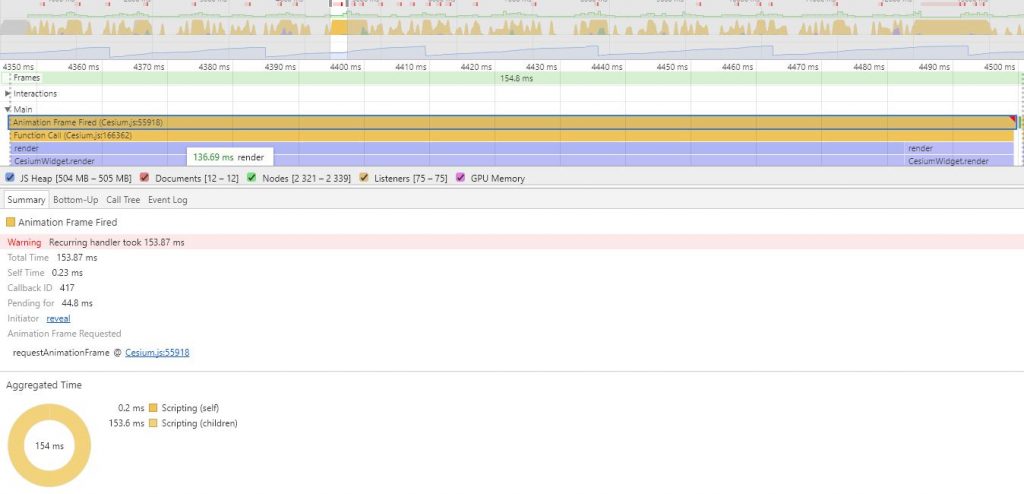
Once I click on the script tile the summary part changes to show more specific info for this part. Now we can use the bottom up or call tree tabs in order to find the functions that cause us the most pain:
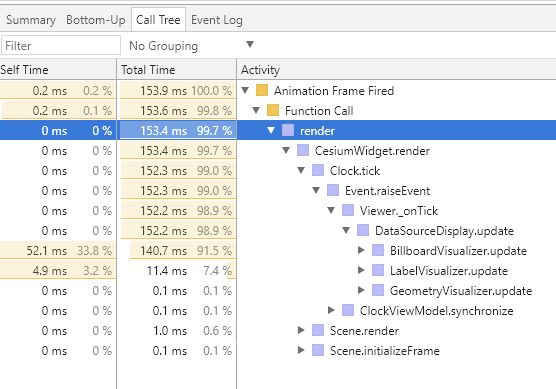
Clicking the “call tree”, I started opening the functions one by one. Animation Frame Fired caused a Function Call, which called “render”, which called CesiumWidget.render and so on. You can see that eventually, at the bottom, BillboardVisualizer.update was causing most of the delay. This is definitely something we need to take care of…
Now let’s see what the big picture tells us. Let’s have a look at the call tree of the whole recording (just click outside a tile in section 4 in figure 3):
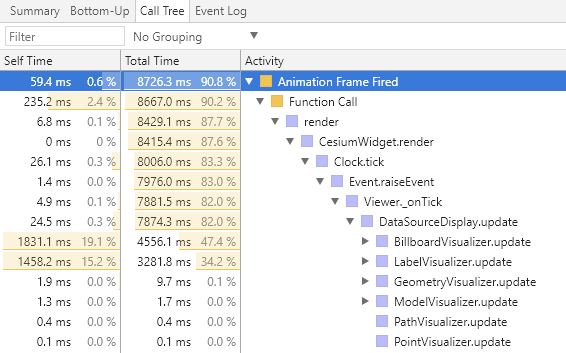
Now we see that BillboardVisualizer is not alone – the LabelVisualizer is also taking around 1/3 of our scripting time. If we could find a way to deal with these two, our 15000 entities app would run better. Can we do that? Let’s see…
The BillboardVisualizer.update method runs a loop on all the billboards in our entity collection. We would need to find a way to make this loop more efficient.
Actually, Cesium combines Graphics in the same DataSource to one Visualizer array, so we actually have 3 such arrays in our app: Billboards, Labels and Geometry (for the ellipses). We see that the GeometryVisualizer is very efficient.
Go ahead and take a look at the code: click to see the code. Try to think of a solution to this problem. Got one? Share in the comments. I’ll share with you one solution in part 2 (coming up real soon).